Source-based research
Utah’s real income total edged up while income per person fell
BEA’s 2024 estimates show why a larger statewide income total does not guarantee a higher average for each resident.
EconomicStabilityIQ · Published
Source period: 2023–2024 BEA real personal income
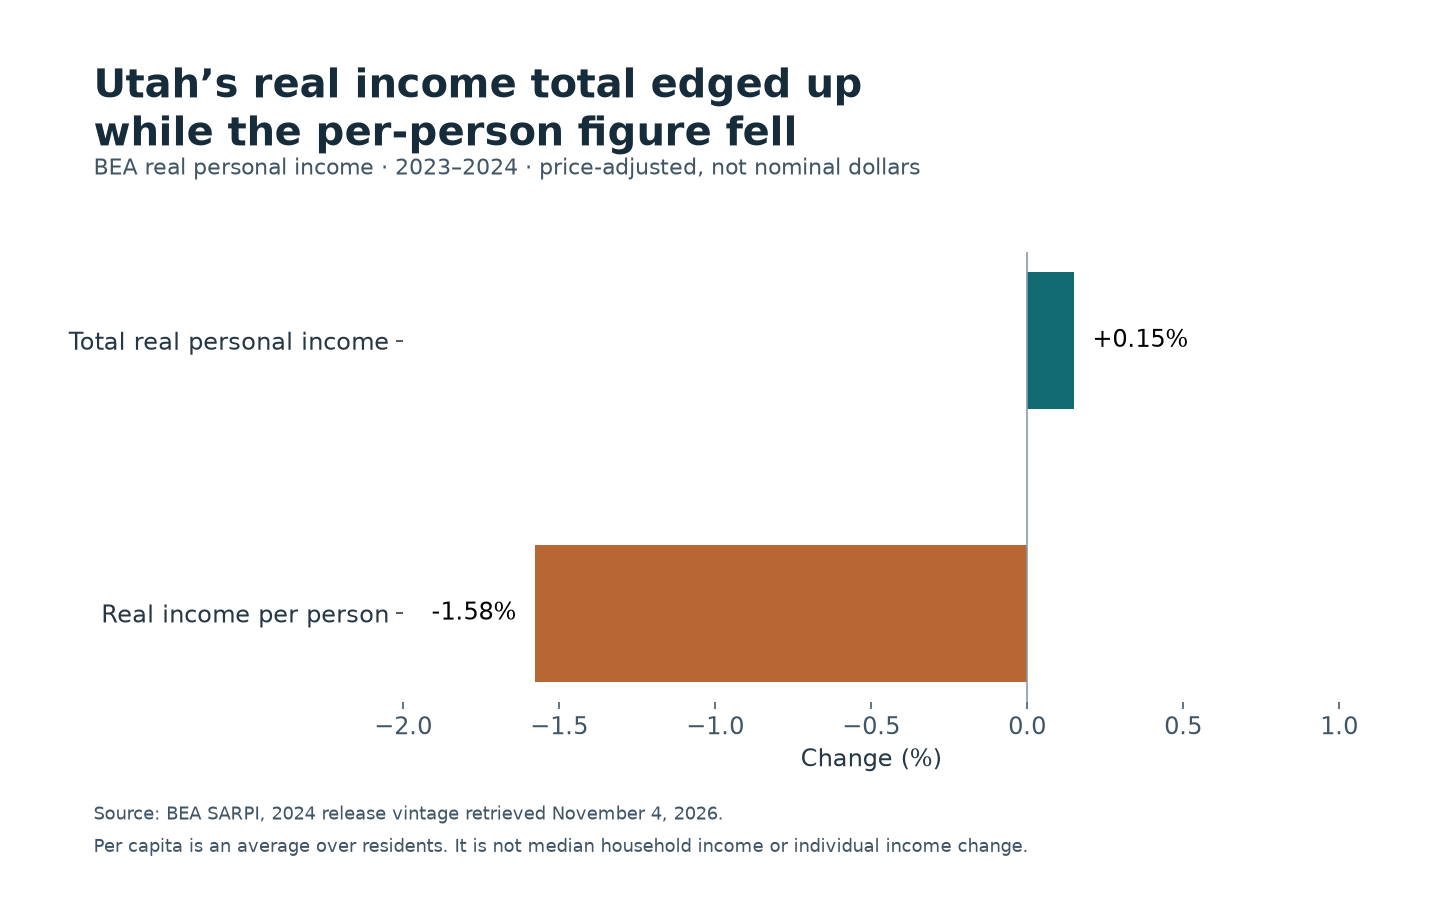
The total and the average moved in opposite directions
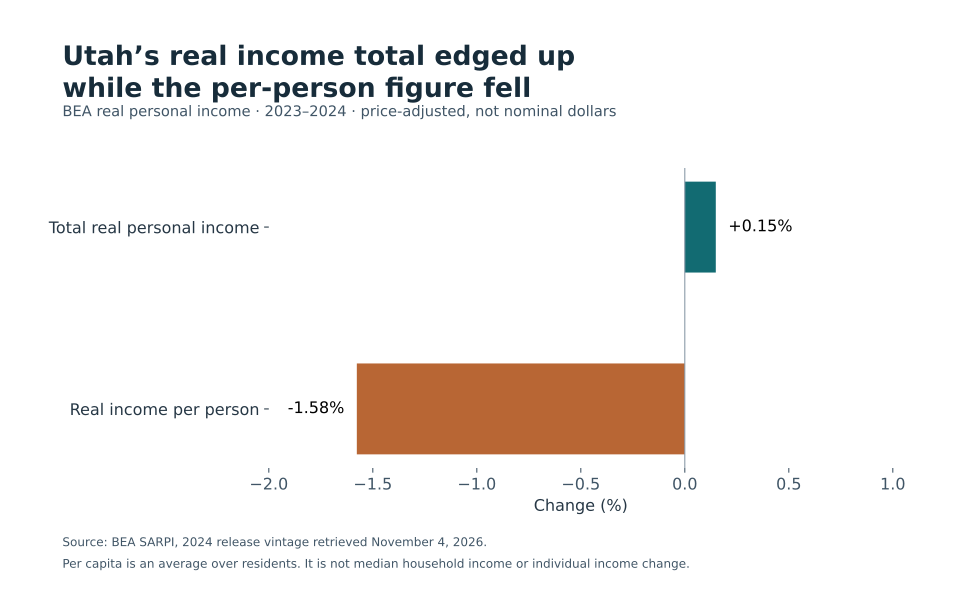
Utah’s total real personal income increased about 0.15% in 2024, while real personal income per person fell about 1.58%. The two results describe the same state and year through different denominators. [1–2]
BEA’s frozen estimates put total real personal income at $192.819 billion in 2023 and $193.106 billion in 2024, in constant 2017 dollars. The corresponding per-capita figures fell from $55,999 to $55,116, a decrease of $883. The small increase in the total was spread across a larger population. [2]
Population connects the two measures
Dividing total real income by real income per person gives the population implicit in the published, rounded figures. The implied population increase is about 1.75%. That is an arithmetic bridge between BEA’s two measures, not an independently estimated migration count.
The relationship is multiplicative: total income growth reflects both the change in the population denominator and the change in income per person. Adding rounded percentage changes is only an approximation. The reproduction file uses the published levels to calculate each change directly.
“Real” also matters. BEA adjusts personal income using regional price parities and the national personal-consumption price index. The result differs from a current-dollar income total. A nominal growth figure from an earlier release or a GDP growth figure answers a different question and should not be placed beside these real-income estimates as if it were the same measure. [1,3]
A statewide average has limits
Per-capita personal income averages across residents, including people who are not employed. Personal income includes more than employee wages. The measure is not median household income, disposable household income or a calculation of what happened to the same person’s pay.
A fall in this average does not establish that every Utah resident lost purchasing power. Distributional changes and population composition can affect the average, and this analysis does not separate those effects. It makes no claim about migration motives, household hardship or an individual financial decision.
The analysis uses BEA’s 2024 release vintage retrieved November 4, 2026. That is the latest annual real-income year identified for this review, not a statement about 2026 income. Revised historical estimates can change the comparison. This research is separate from EconomicStabilityIQ’s modeled scores.
Primary sources
Data and reproducibility
Download this study’s exact data and chart, or the shared reproduction bundle for the ten November 4 EconomicStabilityIQ and CostPressureIQ studies. The bundle contains 17 frozen agency files, source hashes, calculations and an offline Python script. These studies are separate from the sites’ modeled scores.
Verify download integrity (SHA256)
- Study CSV
- 46d9957509263b53b756818a1b5813b6d6fafee237fc7ad597ce516ceb6cef01
- Reproduction ZIP
- 51d3fab135a365e54e57c49a6acaf272ac933365c152d87f507ee16f830ec409