Source-based research
The mix of industries slightly held back U.S. average pay growth in 2025
A decomposition of private covered jobs separates changes in sector average pay from changes in the sectors’ employment shares.
EconomicStabilityIQ · Published
Source period: 2024–2025 annual QCEW
One average contains two moving parts
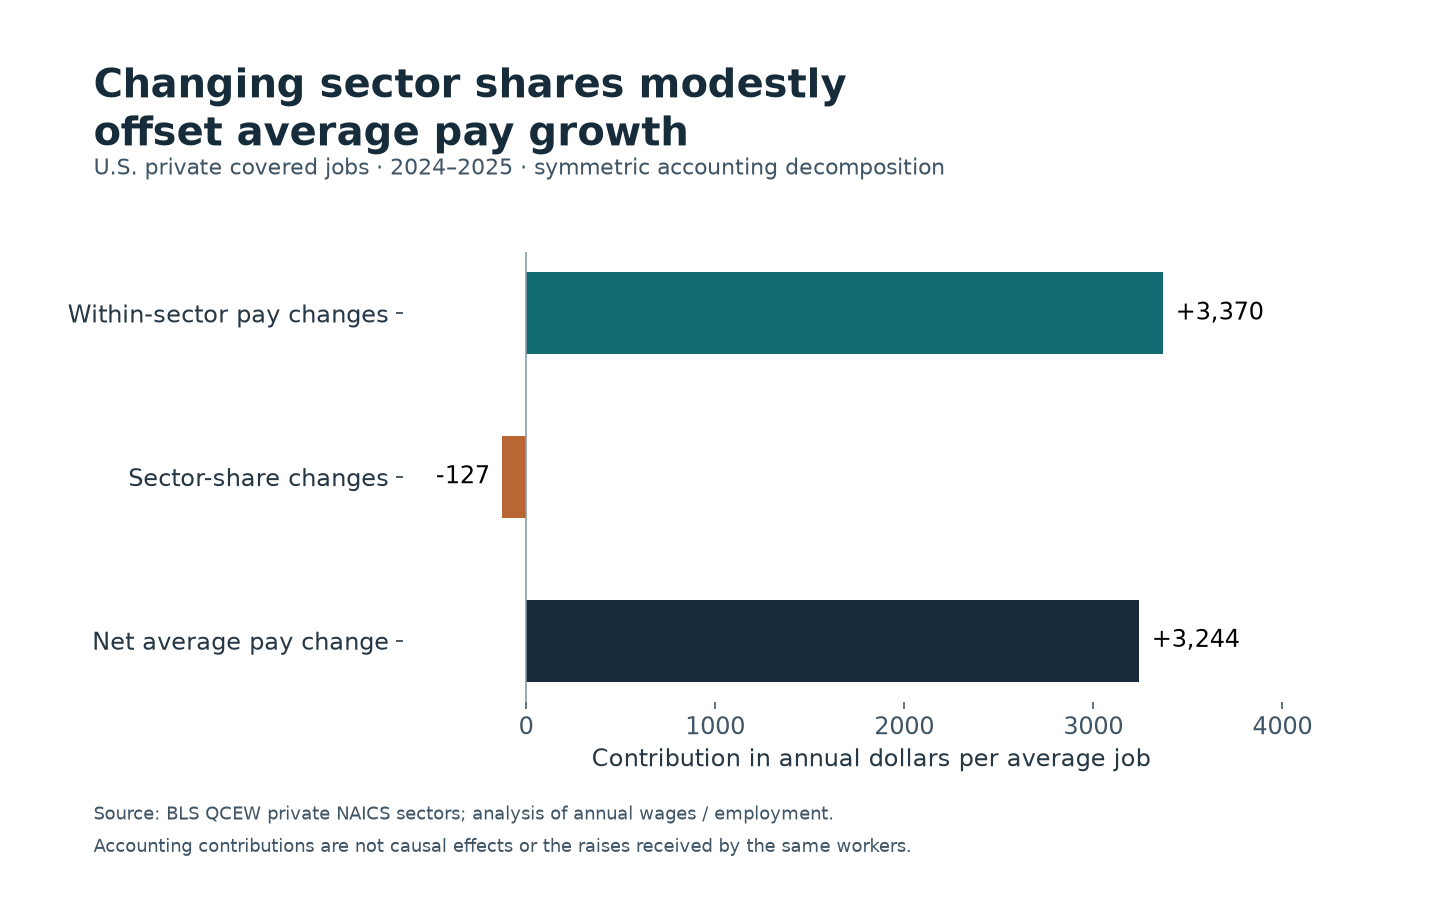
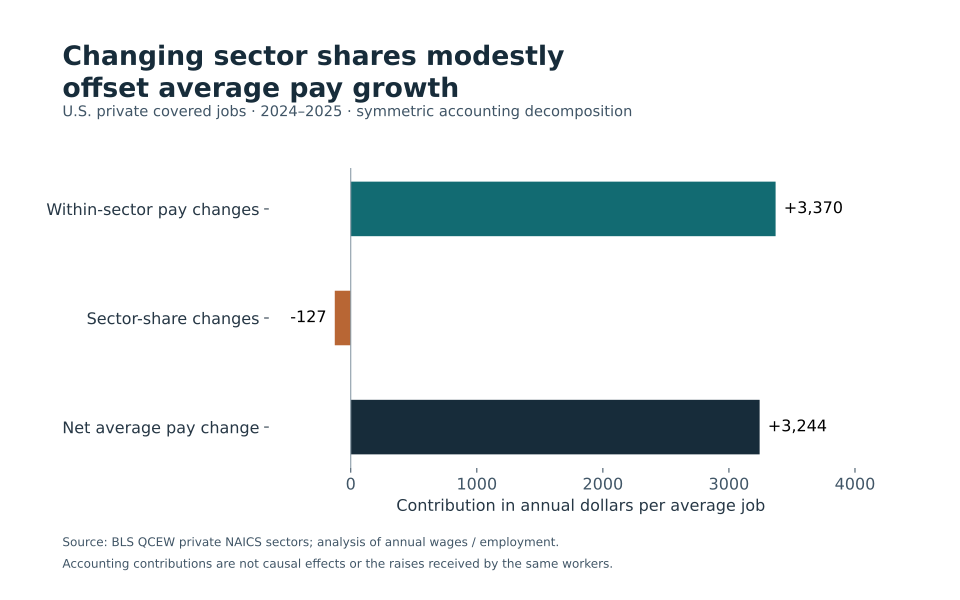
U.S. private-sector average annual pay rose by about $3,244 between 2024 and 2025 in a reconstruction from BLS industry-sector records. Changes in average pay within sectors added about $3,370 to that increase. Changes in the sectors’ employment shares offset about $127. [1–2]
The reconstruction rises from $75,850 to $79,094 per average covered job, an increase of 4.28%. Measured against the 2024 average, the within-sector contribution was about 4.44 percentage points and the employment-mix contribution was about minus 0.17 percentage points. These are nominal dollars, not inflation-adjusted purchasing power.
Separating the components
An economy-wide average can change because pay changes within an industry or because employment becomes more concentrated in industries with different pay levels. This calculation uses a complete set of 20 nonoverlapping private NAICS sectors, including unclassified establishments, from the same annual QCEW snapshots.
For each sector, annual wage dollars are divided by annual average employment. A symmetric decomposition multiplies the change in sector pay by its average employment share across the two years, and the change in employment share by its average pay across the two years. The two terms add exactly to the reconstructed change. Splitting the interaction equally avoids making either year the sole reference point.
Every selected sector is disclosed. Sector wage dollars add to the private total in both years. Summed sector employment is one job below the published private total in each year because of rounding, so the reconstruction consistently uses the summed sector denominator. That discrepancy has a negligible effect on the rounded dollar findings and is retained in the evidence file. [1–2]
An accounting result, not a worker pay raise
The negative mix term means the redistribution of employment shares across these broad sectors modestly reduced the average relative to the within-sector pay movement. It does not say that a particular industry caused workers to become poorer.
The within-sector term can itself reflect changing occupations, hours, full-time versus part-time work, bonuses and the mix of workers. It is not a wage-growth estimate for a fixed panel of employees. QCEW wage totals can include bonuses and stock-option compensation, and covered jobs are not unique people. [3]
No confidence interval or causal effect is estimated. The result depends on the stated sector grouping and the frozen, revisable administrative data. It is a separate national research calculation, not a change to EconomicStabilityIQ’s geographic scores.
Primary sources
Data and reproducibility
Download this study’s exact data and chart, or the shared reproduction bundle for the ten November 4 EconomicStabilityIQ and CostPressureIQ studies. The bundle contains 17 frozen agency files, source hashes, calculations and an offline Python script. These studies are separate from the sites’ modeled scores.
Verify download integrity (SHA256)
- Study CSV
- 188ef41a111f38e9a5de1646927fddd45b5d9f12b4dffd5bb95f6570a563a6e2
- Reproduction ZIP
- 51d3fab135a365e54e57c49a6acaf272ac933365c152d87f507ee16f830ec409