Source-based research
High-rate counties contain less than a third of Michigan’s estimated poverty count
Using an explicit 20% county-rate cutoff shows why a map of poverty rates and a count of people below poverty tell different stories.
EconomicStabilityIQ · Published
Source period: 2024 SAIPE
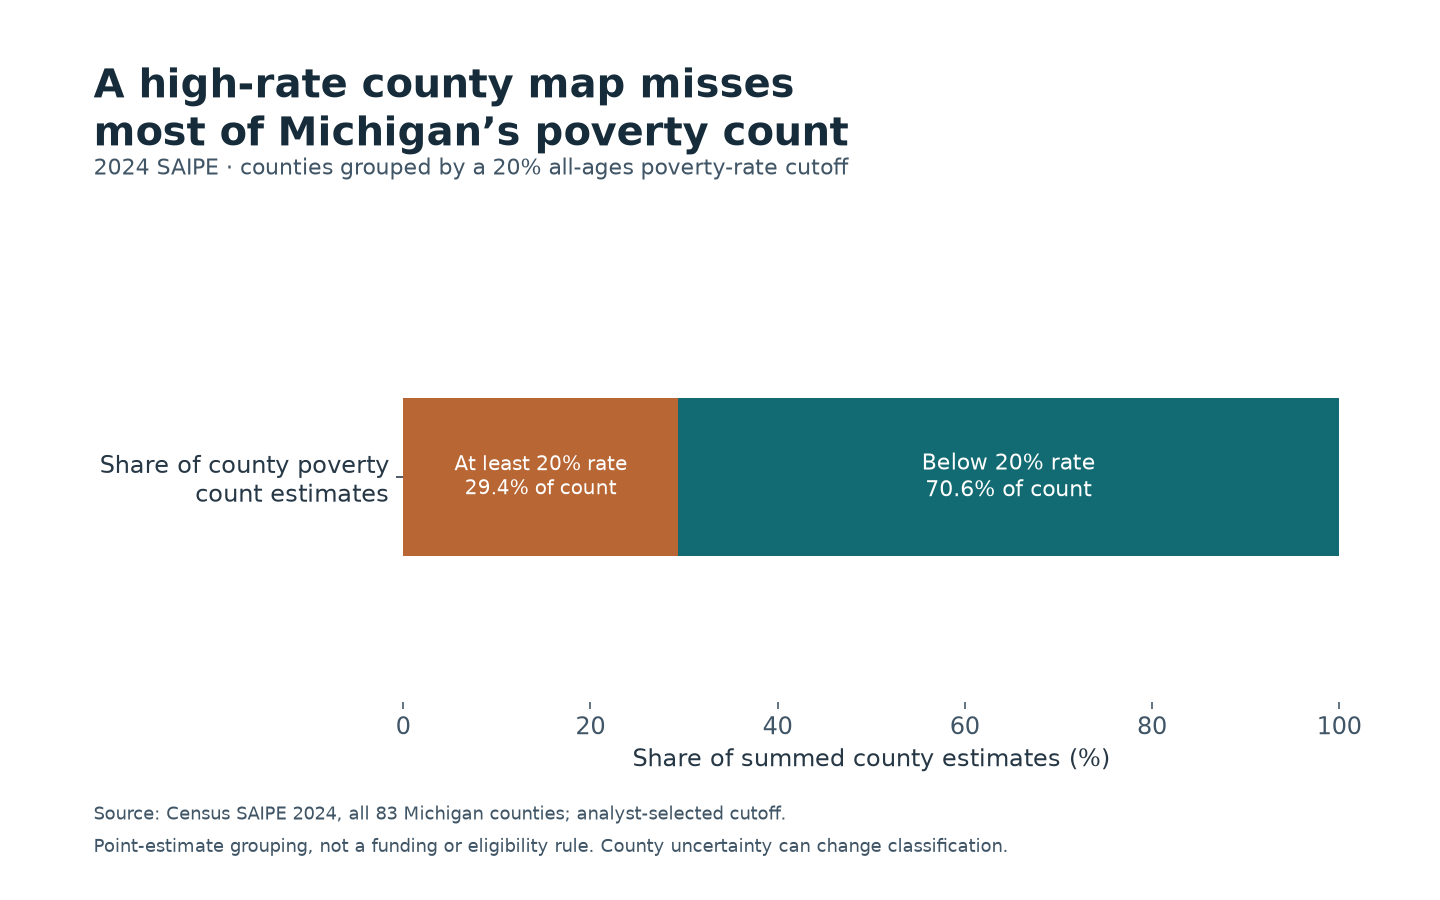
A rate map is not a population count
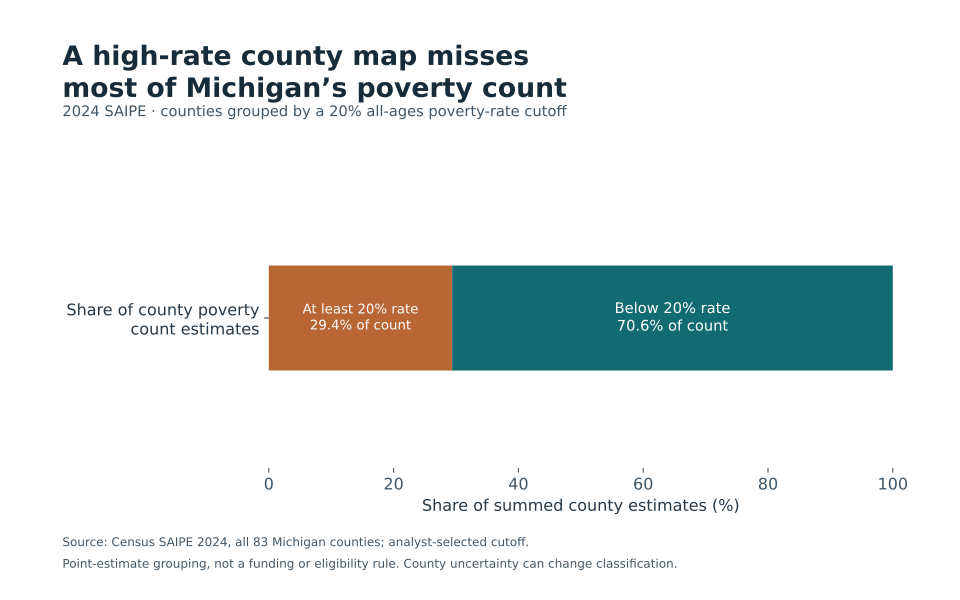
Two Michigan counties had estimated all-ages poverty rates of at least 20% in Census’s 2024 SAIPE data: Lake and Wayne. Together they contained 389,816 people in the county poverty estimates—29.4% of the 1,326,353 summed across Michigan’s 83 counties. The other counties contained 70.6%. [1]
The 20% line is an analyst-selected cutoff used to demonstrate the difference between a rate and a count. It is not an eligibility rule or a label declaring that counties below it have little need. A county can have a lower rate and still contain many residents below poverty.
County size changes the picture
Lake County’s estimated rate was 24.2%, with a poverty count of 2,843. Wayne County’s rate was 22.1%, with a count of 386,973. Both fall above the chosen line, but their counts differ enormously. Giving their rates equal visual weight does not make their populations equal. [1]
The same issue applies outside the highlighted counties. A rate describes the share of a county’s poverty-universe population below the threshold. A count describes the number of people. Summing the counts answers the statewide composition question; averaging the county percentages without population weights does not.
The denominator here is explicitly the sum of published county point estimates. It differs by three people from the separately displayed Michigan state estimate, a small rounding/reconciliation difference that is retained rather than silently replaced.
The cutoff and uncertainty matter
At an 18% cutoff, eight counties contain 40.5% of the summed poverty count. At a 22% cutoff, Lake and Wayne remain the selected counties and contain 29.4%. Those sensitivity checks show what changes when the analytical line moves; they are not tests identifying an objectively correct cutoff.
County rates also have published 90% confidence intervals. Some counties below 20% have upper interval endpoints at or above that line. Selecting every county whose upper endpoint reaches 20% produces nine counties containing 32.1% of the point-estimate poverty count. This is a classification sensitivity exercise, not a simultaneous confidence bound on the statewide share.
SAIPE estimates are model-based and refer to 2024. The data do not measure the full local cost of meeting basic needs, identify program eligibility, or prescribe how funding should be distributed. No county ranking or statistically precise group share is claimed. [1–2]
This analysis is separate from EconomicStabilityIQ’s poverty inputs and modeled scores. Its purpose is to keep the geography of poverty rates distinct from the geography of people below poverty.
Primary sources
Data and reproducibility
Download this study’s exact data and chart, or the shared reproduction bundle for the ten November 4 EconomicStabilityIQ and CostPressureIQ studies. The bundle contains 17 frozen agency files, source hashes, calculations and an offline Python script. These studies are separate from the sites’ modeled scores.
Verify download integrity (SHA256)
- Study CSV
- 949ea90cfe65c858567668cbbefc04a5733bbd065ee47114994620ecf1fc4e61
- Reproduction ZIP
- 51d3fab135a365e54e57c49a6acaf272ac933365c152d87f507ee16f830ec409