Source-based research
Children make up about a third of Louisiana’s poverty count
That is a different statistic from the estimated one in four Louisiana children living below poverty in 2024.
EconomicStabilityIQ · Published
Source period: 2024 SAIPE
Two percentages with different denominators
Children under 18 accounted for an estimated 261,696 of Louisiana’s 829,482 people below poverty in 2024. That makes children about 31.5% of the state’s estimated poverty count. The state’s child poverty rate was 25.0%. Both figures can be correct because they answer different questions. [1]
The 25.0% rate asks what share of Louisiana children were below the poverty threshold. The 31.5% composition figure asks what share of everyone below poverty was a child. Substituting one percentage for the other changes the population being described.
Age matters inside the statewide average
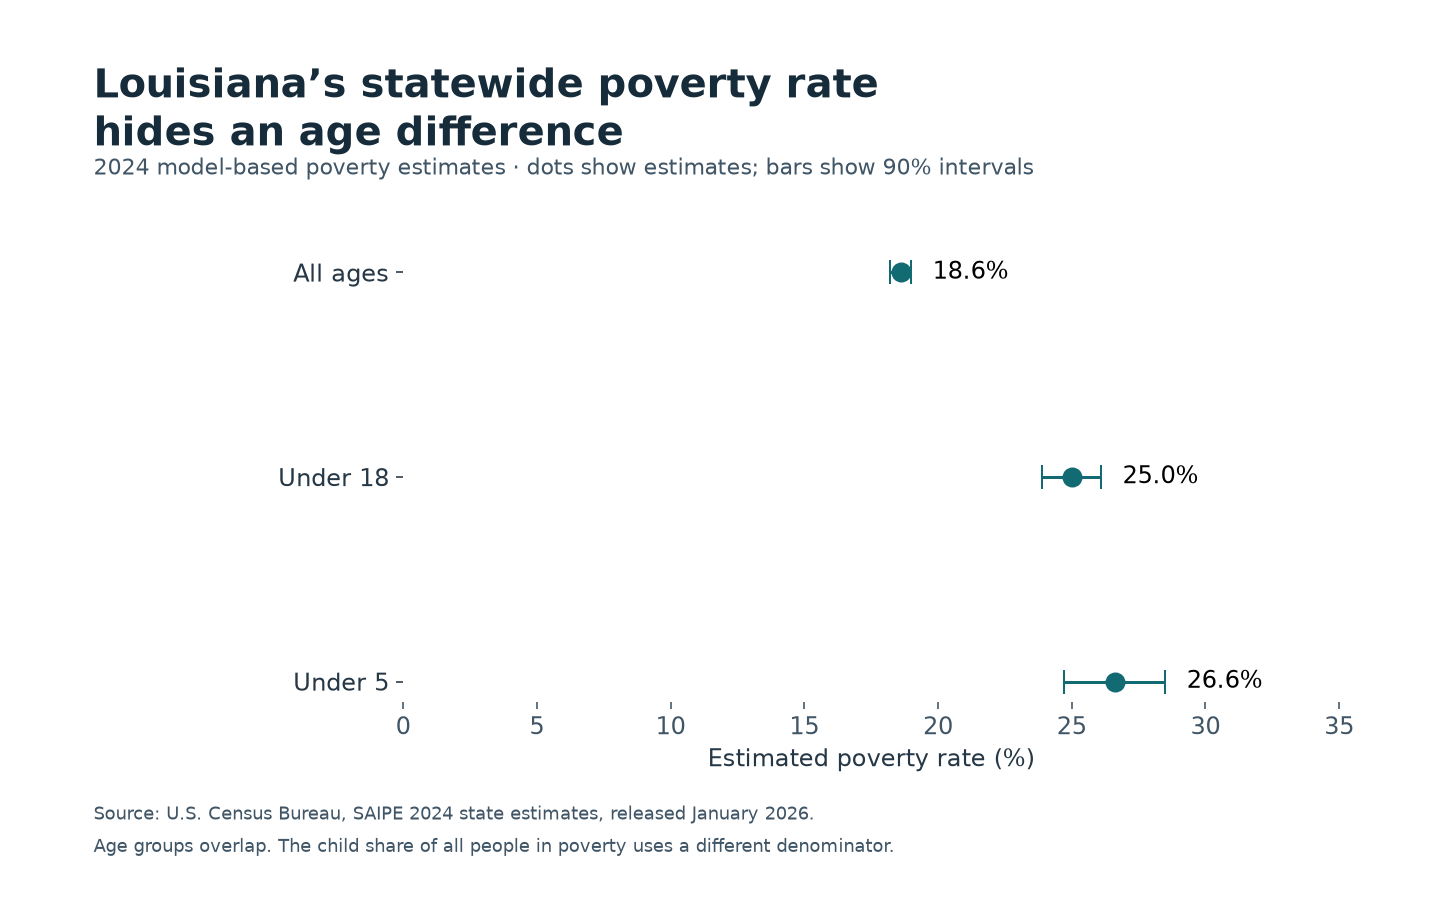
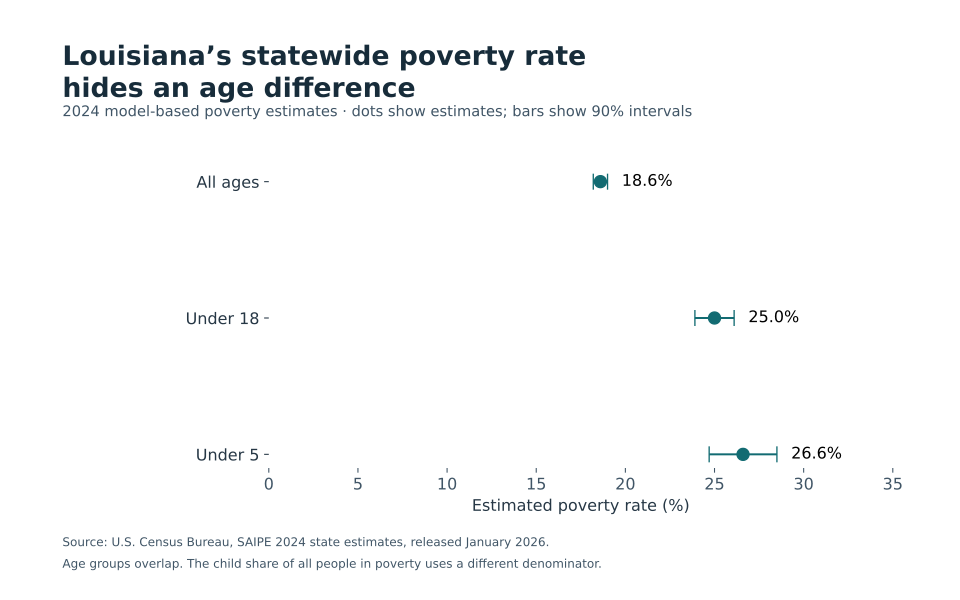
Census’s Small Area Income and Poverty Estimates put Louisiana’s all-ages poverty rate at 18.6%, with a published 90% confidence interval of 18.2% to 19.0%. The under-18 estimate was 25.0%, with an interval of 23.9% to 26.1%. For children under 5, the estimate was 26.6%, with an interval of 24.7% to 28.5%. [1]
The statewide rate therefore describes a broader population than either child rate. It can be useful for an overall poverty picture while obscuring the higher estimated rate among children. These age groups overlap: children under 5 are included among children under 18, and both are included in all ages. The counts and rates should not be added together.
The under-5 and under-18 intervals overlap. The table does not support a claim that the younger group’s rate is statistically higher. Nor is the 31.5% composition figure a published Census confidence interval: it is a ratio of two overlapping point estimates, for which this analysis does not have the covariance needed to calculate an interval.
What the estimates measure
SAIPE combines survey information with administrative records and population inputs to produce annual model-based estimates. These are not a direct enumeration of people experiencing poverty. The data refer to 2024; the state and county files were released in January 2026. The report summarizing them carries a July 2026 cover date. [1–2]
The result does not establish a trend, a national ranking, the cost of meeting a family’s needs in a particular parish, or eligibility for any program. It also does not explain why a family is below poverty. The age-specific count and rate are useful together precisely because they preserve those distinct questions.
This analysis is separate from the poverty input and modeled scores on EconomicStabilityIQ. It makes no change to the site’s source ingestion or score calculations.
Primary sources
Data and reproducibility
Download this study’s exact data and chart, or the shared reproduction bundle for the ten November 4 EconomicStabilityIQ and CostPressureIQ studies. The bundle contains 17 frozen agency files, source hashes, calculations and an offline Python script. These studies are separate from the sites’ modeled scores.
Verify download integrity (SHA256)
- Study CSV
- beb947ef645e82a8b7fdf7bd58250de8fe43c4d4f9ef7997739f99210cb9c4db
- Reproduction ZIP
- 51d3fab135a365e54e57c49a6acaf272ac933365c152d87f507ee16f830ec409