Source-based research
Information industries account for a quarter of King County’s private wages
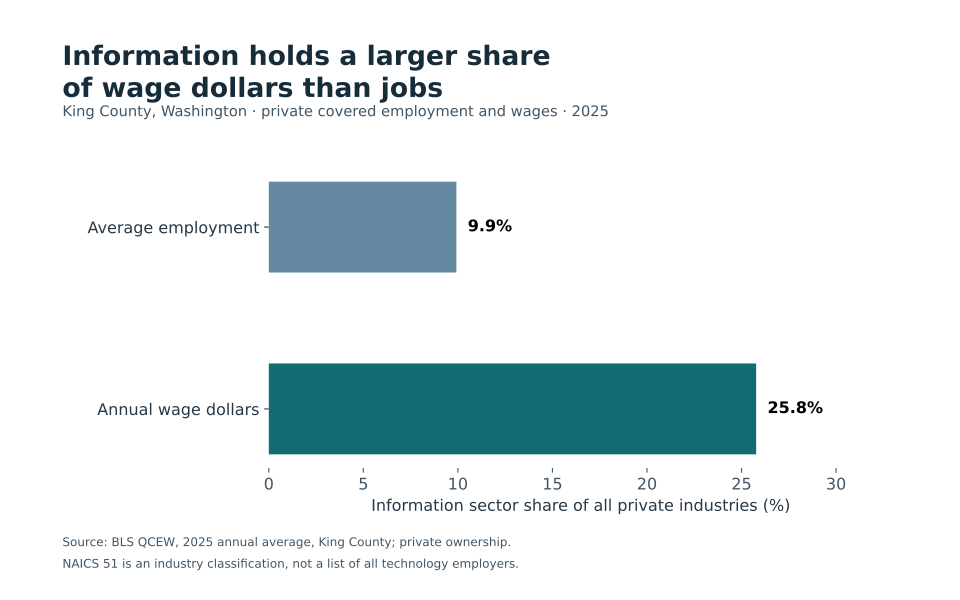
The sector held 9.9% of average private covered employment but 25.8% of annual wage dollars in 2025.
EconomicStabilityIQ · Published
Source period: 2025 annual QCEW
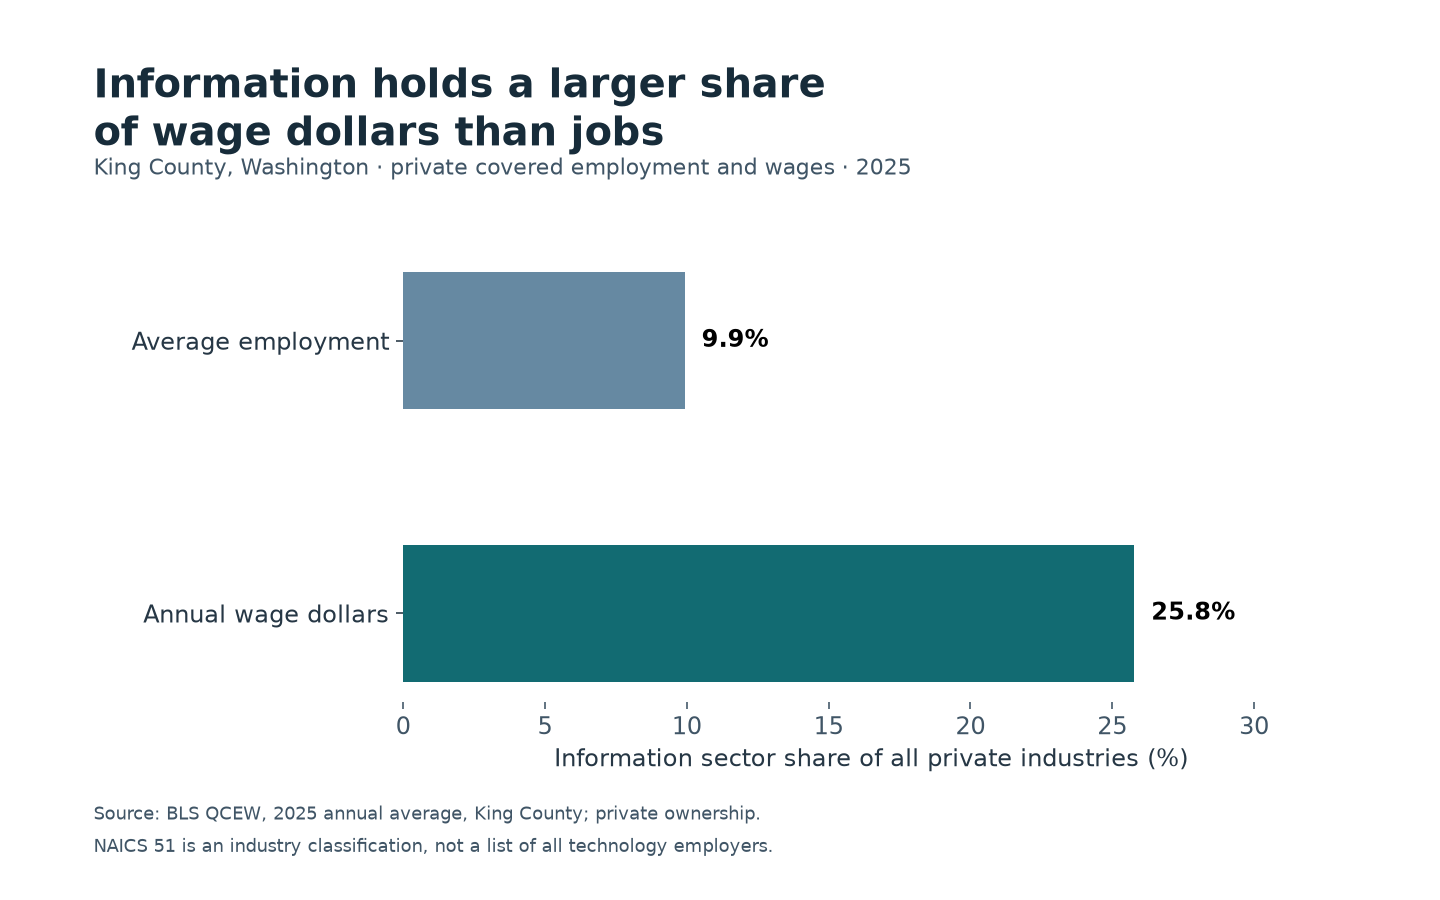
Jobs and wage dollars have different concentrations
King County’s information sector accounted for roughly one in ten private covered jobs in 2025 and more than one in four private wage dollars. The distinction matters when a county’s industry dependence is described using only employment shares. [1]
BLS’s Quarterly Census of Employment and Wages reports annual average information-sector employment of 124,566, compared with 1,255,504 across all private industries in the county. Dividing the sector by the private total gives 9.92%. Its $45.93 billion in annual wages represented 25.77% of the county’s $178.21 billion private wage total. [1]
What is inside the comparison
Both shares use the same county, calendar year and private ownership universe. The information sector is NAICS 51. It is an industry classification, not a comprehensive list of technology companies or technology occupations. People working in technology roles outside that industry are not added to this sector.
Employment is an average of the monthly covered-job counts. Wage dollars are summed across the year. The wage measure includes more than base salary: under most state unemployment-insurance laws, reported wages can include bonuses, stock options and other compensation. High annual wages therefore do not imply that every worker received the sector’s average pay. [2]
What this can and cannot show
The two shares describe different kinds of concentration. A sector can occupy a modest share of jobs while accounting for a much larger share of reported compensation. That distinction provides context for discussions of the local earnings base, without turning an employment share into a forecast of household finances.
The data do not identify the employers responsible for the result, the distribution of wages among employees, or how much of the wage income was received by King County residents. The workplace location of a job and the residence of its worker are different geographic concepts. No household spending, tax-revenue or housing-price effect is estimated here.
QCEW is based primarily on unemployment-insurance records, rather than a household survey. Covered employment excludes some work, and administrative reporting, classification changes and later revisions remain relevant. The selected total and information rows are disclosed in the frozen file; suppressed values were not treated as zero. [1–2]
This research comparison is separate from EconomicStabilityIQ’s industry-diversification pillar. It neither recalculates that score nor supplies a probability of an economic downturn.
Primary sources
Data and reproducibility
Download this study’s exact data and chart, or the shared reproduction bundle for the ten November 4 EconomicStabilityIQ and CostPressureIQ studies. The bundle contains 17 frozen agency files, source hashes, calculations and an offline Python script. These studies are separate from the sites’ modeled scores.
Verify download integrity (SHA256)
- Study CSV
- edebea3515f6c41591aaddc7d4fdb59529608f5dacf688b053b5969d2d14d93a
- Reproduction ZIP
- 51d3fab135a365e54e57c49a6acaf272ac933365c152d87f507ee16f830ec409