Source-based research
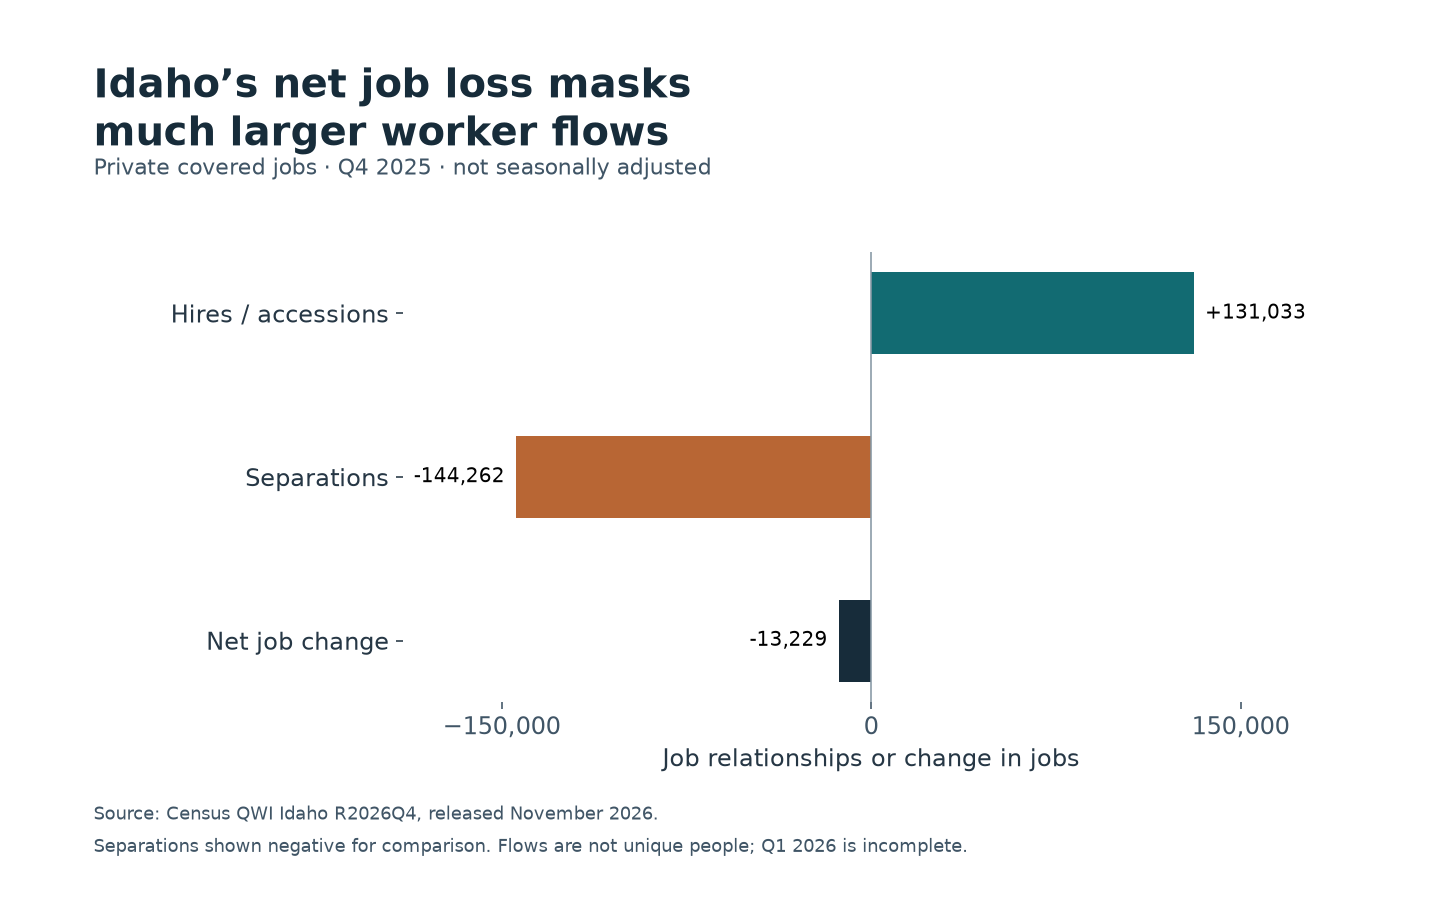
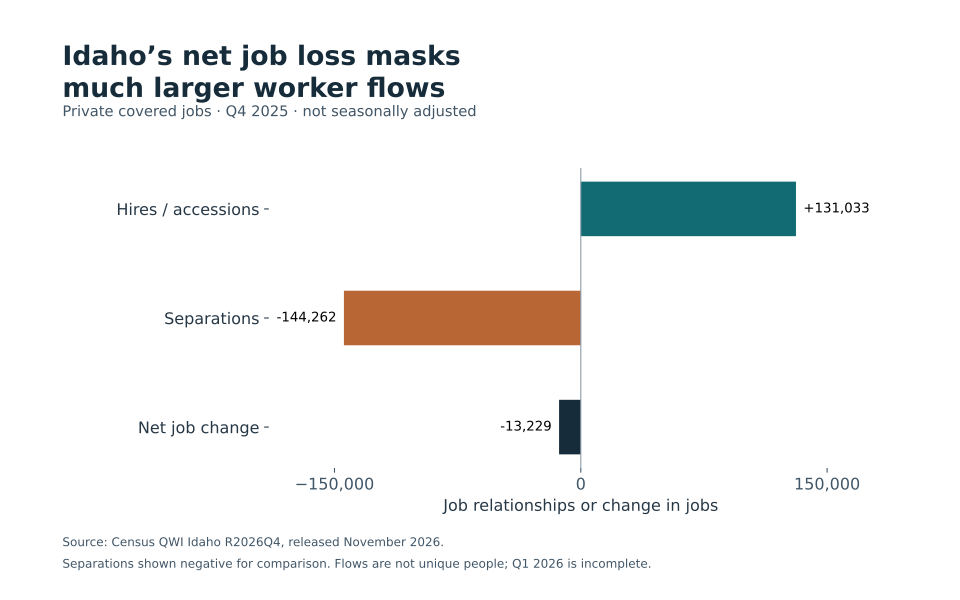
Idaho’s net job loss masks much larger hiring and separation flows
The latest quarter with both measures shows 131,033 hires and 144,262 separations in private covered jobs.
EconomicStabilityIQ · Published
Source period: Q4 2025; QWI R2026Q4, not seasonally adjusted
A net change is not the volume of activity
Idaho’s private covered jobs declined by 13,229 during the fourth quarter of 2025 in the Census Bureau’s Quarterly Workforce Indicators. Behind that net change were 131,033 hires and 144,262 separations. A single net number describes the balance between those flows, not how much hiring and separation occurred. [1–2]
Beginning-of-quarter employment was 758,713 and end-of-quarter employment was 745,484. Their difference matches hires minus separations in the selected row. A separate firm-flow calculation also reconciles: 36,355 jobs gained at growing firms minus 49,584 lost at shrinking firms equals the same net decline of 13,229. [1]
Workers’ flows and firms’ net changes are different
Hires and separations describe starts and ends of worker-employer job relationships. Growing and shrinking firms’ job totals describe changes in their employment levels. A firm can hire replacements without increasing its headcount, so adding all hires is not equivalent to counting newly created positions.
The 275,295 combined hiring and separation events are not 275,295 unique Idaho residents. A person can hold more than one job, and a relationship can begin and end within the period. A separation does not by itself establish a layoff: the data here do not identify whether a worker quit, retired, moved or left for another reason. [2–3]
Why the comparison stops at Q4 2025
The file comes from the November 2026 R2026Q4 release and includes a Q1 2026 row. That newer row has hires but lacks separations and end-of-quarter employment, so it cannot support the same comparison. This analysis uses Q4 2025 because it is the latest complete quarter for the specified measures, not because Q1 2026 contains zero separations. [1–2]
The selected row is statewide, private ownership, all industries, all ages and both sexes, with all firm ages and sizes. It is not seasonally adjusted. The calculation therefore does not interpret the fourth-quarter decline as a seasonally adjusted recession signal or an annual trend.
The selected component fields carry Census status flag 1, labeled “OK.” QWI still uses linked administrative data, imputation and disclosure protection; the flag is not a confidence interval or a guarantee of error-free counts. No significance test or causal interpretation is made.
This is a separate workforce-flow analysis, not a revision to EconomicStabilityIQ’s annual modeled scores or an estimate of a worker’s job-loss probability.
Primary sources
Data and reproducibility
Download this study’s exact data and chart, or the shared reproduction bundle for the ten November 4 EconomicStabilityIQ and CostPressureIQ studies. The bundle contains 17 frozen agency files, source hashes, calculations and an offline Python script. These studies are separate from the sites’ modeled scores.
Verify download integrity (SHA256)
- Study CSV
- 396561f7f88ef2c8dd6c5a0c92076aac80ea96ec02f9db44273624a03f9765f9
- Reproduction ZIP
- 51d3fab135a365e54e57c49a6acaf272ac933365c152d87f507ee16f830ec409