Source-based research
California’s lower unemployment rate came with fewer employed residents
BLS estimates show unemployment and employment both falling over the year to September 2026, while the labor force contracted by about 379,000 people.
EconomicStabilityIQ · Published
Source period: September 2025–September 2026; preliminary, seasonally adjusted
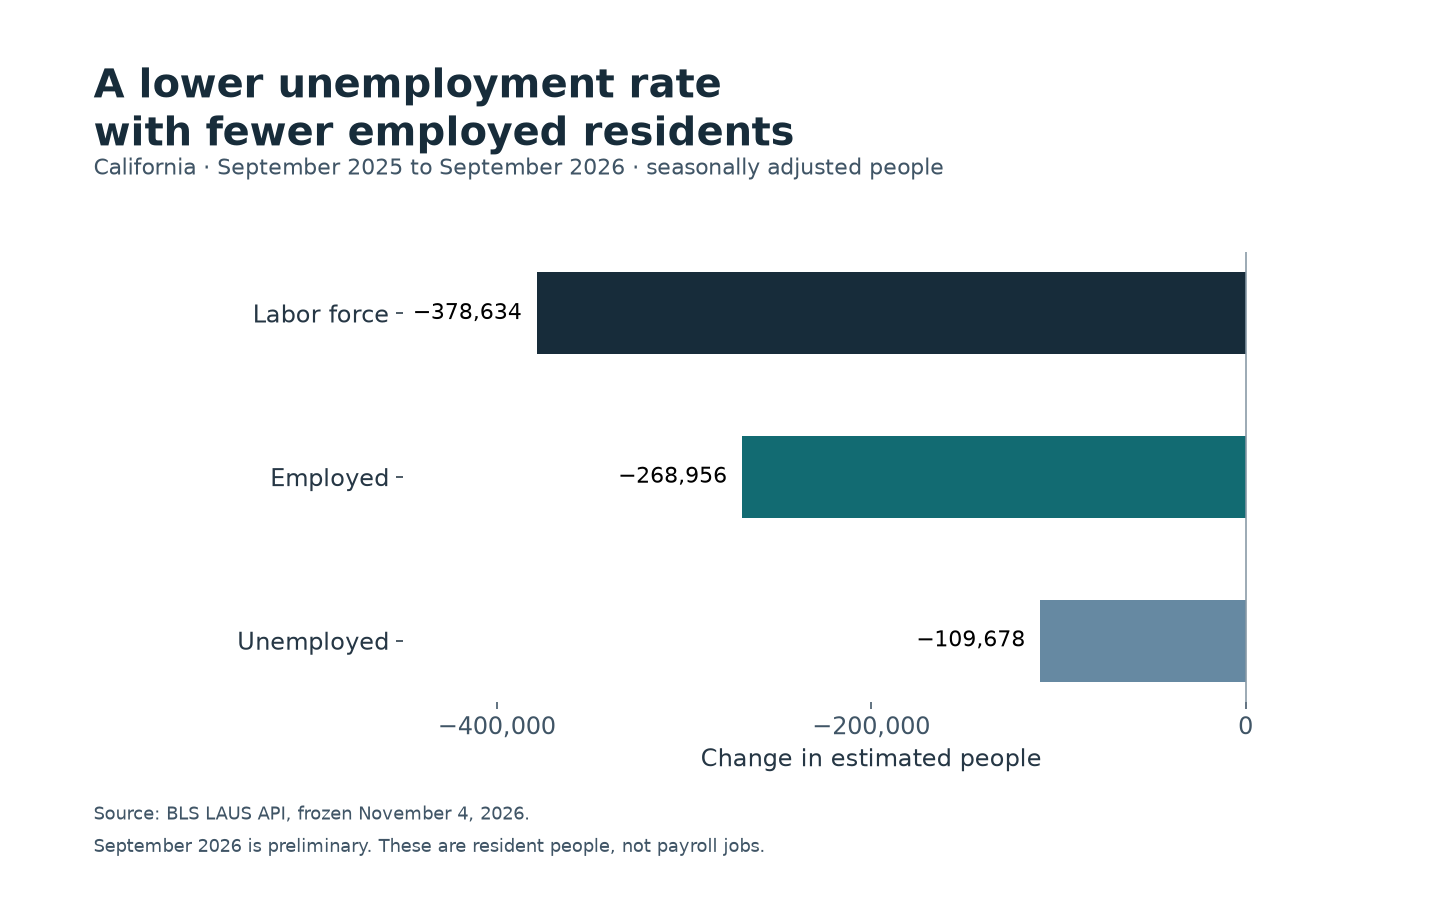
Two declines behind one rate
California’s unemployment rate fell from 5.5% in September 2025 to 5.1% in September 2026. Over the same period, the estimated number of employed California residents fell by 268,956. The two results are compatible because the unemployment rate measures unemployed people as a share of the labor force, not the share of residents who gained jobs. [1–4]
The frozen BLS Local Area Unemployment Statistics series put employment at 18,759,323 in September 2025 and 18,490,367 a year later. Unemployment fell from 1,097,295 to 987,617, a decline of 109,678. Together, those changes account for the labor force falling by 378,634, from 19,856,618 to 19,477,984. These are seasonally adjusted estimates; September 2026 is preliminary. [1–4]
What the arithmetic says
A smaller unemployment count can lower the rate even when employment also declines. Dividing each year’s unemployment estimate by its labor-force estimate reproduces the published rates after rounding. This is an accounting explanation of the two snapshots. It does not identify who moved from work to unemployment, who left the labor force, or why they did so.
The employment figure here counts people by where they live. California’s separate payroll-job series counts jobs at establishments. A person with multiple jobs, a self-employed resident, or a commuter can therefore affect the two systems differently. The California Employment Development Department’s September release reports the resident employment decline alongside a year-over-year payroll-job increase; one series should not be substituted for the other. [5]
How to read the finding
The state release already presents these labor-force changes. The additional value of putting them together is to show why a lower unemployment rate alone is incomplete evidence of improving resident employment. It is not a finding that the unemployment statistics are wrong.
LAUS estimates are modeled from survey and administrative inputs and are subject to revision and annual benchmarking. The calculations here do not establish statistical significance for the employment or labor-force changes. They cannot attribute the changes to migration, retirement, policy or discouraged job search.
This one-year comparison is a separate EconomicStabilityIQ research analysis. It does not alter the site’s annual modeled scores or establish the probability that any resident will lose a job.
Primary sources
Data and reproducibility
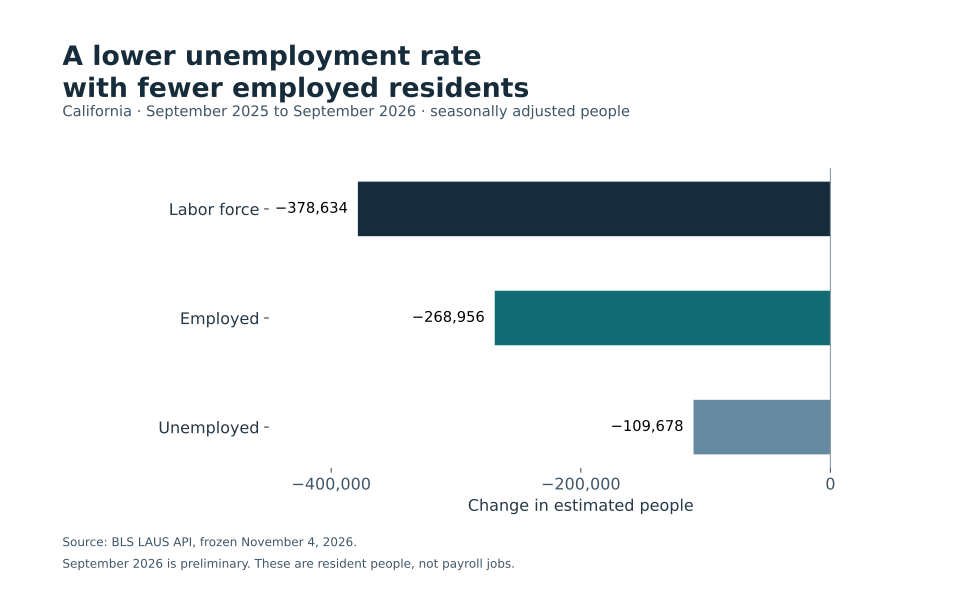
Download this study’s exact data and chart, or the shared reproduction bundle for the ten November 4 EconomicStabilityIQ and CostPressureIQ studies. The bundle contains 17 frozen agency files, source hashes, calculations and an offline Python script. These studies are separate from the sites’ modeled scores.
Verify download integrity (SHA256)
- Study CSV
- f886da21ec5f99f2ed7a0325009e3b5ad29e580e8666c1a6d6ff34404068c13d
- Reproduction ZIP
- 51d3fab135a365e54e57c49a6acaf272ac933365c152d87f507ee16f830ec409